| INTRODUCTION |
|
In recent years, the capabilities of ultrasound flow imaging have
increased enormously. Color flow imaging is now commonplace and
facilities such as ‘power’ or ‘energy’ Doppler
provide new ways of imaging flow. With such versatility, it is tempting
to employ the technique for ever more demanding applications and
to try to measure increasingly subtle changes in the maternal and
fetal circulations. To avoid misinterpretation of results, however,
it is essential for the user of Doppler ultrasound to be aware of
the factors that affect the Doppler signal, be it a color flow image
or a Doppler sonogram.
|
Competent use of Doppler ultrasound techniques requires an understanding
of three key components:
(1) The capabilities and limitations of Doppler ultrasound;
(2) The different parameters which contribute to the flow display;
(3) Blood flow in arteries and veins.
This chapter describes how these components contribute to the quality
of Doppler ultrasound images. Guidelines are given on how to obtain
good images in all flow imaging modes. For further reading on the
subject, there are texts available covering Doppler ultrasound and
blood flow theory in more detail 1-3 .
|
|
BASIC PRINCIPLES |
Ultrasound images of flow, whether color flow or spectral Doppler,
are essentially obtained from measurements of movement. In ultrasound
scanners, a series of pulses is transmitted to detect movement of
blood. Echoes from stationary tissue are the same from pulse to
pulse. Echoes from moving scatterers exhibit slight differences
in the time for the signal to be returned to the receiver (Figure
1 ). These differences can be measured as a direct
time difference or, more usually, in terms of a phase shift from
which the ‘Doppler frequency’ is obtained (Figure
2). They are then processed to produce either a color
flow display or a Doppler sonogram.
|
 |
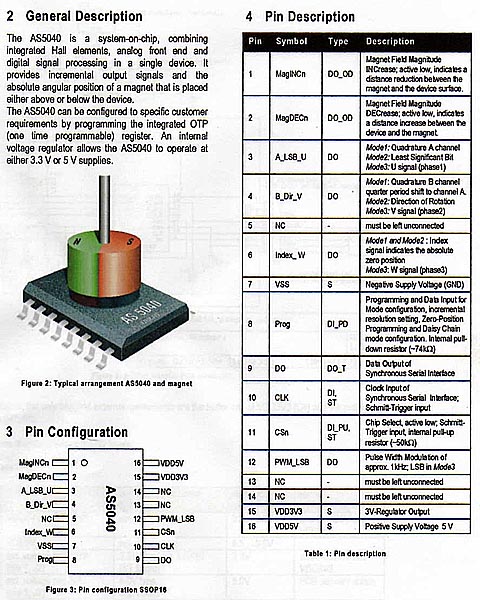
Figure
1 Ultrasound velocity measurement. The diagram shows
a scatterer S moving at velocity V with a beam/flow angle
q.
The velocity can be calculated by the difference in transmit-to-receive
time from the first pulse to the second (t2), as
the scatterer moves through the beam.
|
|
|
|
Figure
2: Doppler ultrasound. Doppler ultrasound measures the
movement of the scatterers through the beam as a phase change
in the received signal. The resulting Doppler frequency
can be used to measure velocity if the beam/flow angle is
known.
|
|
As
can be seen from Figures
1 and
2, there has to be motion in the direction of the
beam; if the flow is perpendicular to the beam, there is no relative
motion from pulse to pulse. The size of the Doppler signal is
dependent on:
(1) Blood velocity: as velocity increases, so does the Doppler
frequency;
(2) Ultrasound frequency: higher ultrasound frequencies give increased
Doppler frequency. As in B-mode, lower ultrasound frequencies
have better penetration.
(3) The choice of frequency is a compromise between better sensitivity
to flow or better penetration;
(4 The angle of insonation: the Doppler frequency increases as
the Doppler ultrasound beam becomes more aligned to the flow direction
(the angle q between the beam and the direction of flow
becomes smaller). This is of the utmost importance in the use
of Doppler ultrasound. The implications are illustrated schematically
in Figure 3.
|
|
|
|
Figure
3 - Effect of the Doppler angle in the sonogram. (A)
higher-frequency Doppler signal is obtained if the beam
is aligned more to the direction of flow. In the diagram,
beam (A) is more ali)gned than (B)
and produces higher-frequency Doppler signals. The beam/flow
angle at (C) is almost 90° and there is
a very poor Doppler signal. The flow at (D)
is away from the beam and there is a negative signal.
|
|
|
All
types of Doppler ultrasound equipment employ filters to cut out
the high amplitude, low-frequency Doppler signals resulting from
tissue movement, for instance due to vessel wall motion. Filter
frequency can usually be altered by the user, for example, to exclude
frequencies below 50, 100 or 200 Hz. This filter frequency limits
the minimum flow velocities that can be measured.
|
|
CONTINUOUS
WAVE AND PULSED WAVE
|
As
the name suggests, continuous wave systems use continuous transmission
and reception of ultrasound. Doppler signals are obtained from all
vessels in the path of the ultrasound beam (until the ultrasound
beam becomes sufficiently attenuated due to depth). Continuous wave
Doppler ultrasound is unable to determine the specific location
of velocities within the beam and cannot be used to produce color
flow images. Relatively inexpensive Doppler ultrasound systems are
available which employ continuous wave probes to give Doppler output
without the addition of B-mode images. Continuous wave Doppler is
also used in adult cardiac scanners to investigate the high velocities
in the aorta.
|
|
|
|
Continuous-wave
doppler transducer
|
|
|
|
Pulsed-wave
doppler transducer
|
|
Doppler
ultrasound in general and obstetric ultrasound scanners uses pulsed
wave ultrasound. This allows measurement of the depth (or range)
of the flow site. Additionally, the size of the sample volume (or
range gate) can be changed. Pulsed wave ultrasound is used to provide
data for Doppler sonograms and color flow images.
|
| Aliasing |
Pulsed
wave systems suffer from a fundamental limitation. When pulses are
transmitted at a given sampling frequency (known as the pulse repetition
frequency), the maximum Doppler frequency fd that can be measured
unambiguously is half the pulse repetition frequency. If the blood
velocity and beam/flow angle being measured combine to give a fd
value greater than half of the pulse repetition
frequency, ambiguity in the Doppler signal occurs. This ambiguity
is known as aliasing. A similar effect is seen in films where wagon
wheels can appear to be going backwards due to the low frame rate
of the film causing misinterpretation of the movement of the wheel
spokes.
|
|
|
 |
Figure
4 : Aliasing of color doppler imaging and artefacts
of color. Color image shows regions of aliased flow (yellow
arrows).
|
Figure
5 : Reduce color gain and increase pulse repetition
frequency. |
| |
|
|
|
|
Figure
6 (a,b): Example of aliasing and correction of the
aliasing. (a) Waveforms with aliasing, with abrupt termination
of the peak systolic and display this peaks bellow the baseleineSonogram
clear without aliasing. (b) Correction: increased the pulse
repetition frequency and adjust baseline (move down)
|
|
The
pulse repetition frequency is itself constrained by the range of
the sample volume. The time interval between sampling pulses must
be sufficient for a pulse to make the return journey from the transducer
to the reflector and back. If a second pulse is sent before the
first is received, the receiver cannot discriminate between the
reflected signal from both pulses and ambiguity in the range of
the sample volume ensues. As the depth of investigation increases,
the journey time of the pulse to and from the reflector is increased,
reducing the pulse repetition frequency for unambiguous ranging.
The result is that the maximum fd
measurable decreases with depth.
Low
pulse repetition frequencies are employed to examine low velocities
(e.g. venous flow). The longer interval between pulses allows the
scanner a better chance of identifying slow flow. Aliasing will
occur if low pulse repetition frequencies or velocity scales are
used and high velocities are encountered (Figure
4,5 and 6). Conversely, if a high pulse repetition
frequency is used to examine high velocities, low velocities may
not be identified.
|
 |
Figure
7 (a,b): Color flow imaging: effects
of pulse repetition frequency or scale. (above) The pulse
repetition frequency or scale is set low (yellow arrow). The
color image shows ambiguity within the umbilical artery and
vein and there is extraneous noise. (b) The pulse repetition
frequency or scale is set appropriately for the flow velocities
(bottom). The color image shows the arteries and vein clearly
and unambiguously.
|
|
|
|
|
| ULTRASOUND
FLOW MODES |
|
Since
color flow imaging provides a limited amount of information over
a large region, and spectral Doppler provides more detailed information
about a small region, the two modes are complementary and, in practice,
are used as such.
Color
flow imaging can be used to identify vessels requiring examination,
to identify the presence and direction of flow, to highlight gross
circulation anomalies, throughout the entire color flow image, and
to provide beam/vessel angle correction for velocity measurements.
Pulsed wave Doppler is used to provide analysis of the flow at specific
sites in the vessel under investigation. When using color flow imaging
with pulsed wave Doppler, the color flow/B-mode image is frozen
while the pulsed wave Doppler is activated. Recently, some manufacturers
have produced concurrent color flow imaging and pulsed wave Doppler,
sometimes referred to as triplex scanning.
When
these modes are used simultaneously, the performance of each is
decreased. Because transducer elements are employed in three modes
(B-mode, color flow and pulsed wave Doppler), the frame rate is
decreased, the color flow box is reduced in size and the available
pulse repetition frequency is reduced, leading to increased susceptibility
to aliasing.
Power Doppler is also referred to as energy Doppler, amplitude Doppler
and Doppler angiography. The magnitude of the color flow output
is displayed rather than the Doppler frequency signal. Power Doppler
does not display flow direction or different velocities. It is often
used in conjunction with frame averaging to increase sensitivity
to low flows and velocities. It complements the other two modes
(Table 01).
Hybrid color flow modes incorporating power and velocity data are
also available from some manufacturers. These can also have improved
sensitivity to low flow. A brief summary of factors influencing
the displays in each mode is given in the following sections. Most
of these factors are set up approximately for a particular mode
when the application (e.g. fetal scan) is chosen, although the operator
will usually alter many of the controls during the scan to optimize
the image.
|
| Table
1 - Flow imaging modes |
| Spectral
Doppler |
- Examines
flow at one site
- Detailed
analysis of distribution of flow
- Good
temporal resolution – can examine flow waveform
- Allows
calculations of velocity and indices
|
| Color
flow |
- Overall
view of flow in a region
- Limited
flow information
- Poor
temporal resolution/flow dynamics (frame rate can be low
when scanning deep)
- color
flow map (diferent color maps)
- direction
information
- velocyty
information (high velocity & low velocity)
- turbulent
flows
|
|
COLOR
FLOW MAPS (DIRECTIONAL)
|
 |
 |
 |
 |
 |
 |
 |
 |
|
| Power/energy/amplitude
flow |
- Sensitive
to low flows
- No
directional information in some modes
- Very
poor temporal resolution
- Susceptible
to noise
|
|
|
 |
| "Color
Power Angio" of the Circle of Willis |
"Color
Power Angio" of a submucosus fibroid, note the small
vessels inside the tumor. |
|
|
|
|
| Color
flow imaging |
Color
flow Doppler ultrasound produces a color-coded map of Doppler shifts
superimposed onto a B-mode ultrasound image (Color
Flow Maps). Although color flow imaging uses pulsed
wave ultrasound, its processing differs from that used to provide
the Doppler sonogram. Color flow imaging may have to produce several
thousand color points of flow information for each frame superimposed
on the B-mode image. Color flow imaging uses fewer, shorter pulses
along each color scan line of the image to give a mean frequency
shift and a variance at each small area of measurement. This frequency
shift is displayed as a color pixel. The scanner then repeats this
for several lines to build up the color image, which is superimposed
onto the B-mode image. The transducer elements are switched rapidly
between B-mode and color flow imaging to give an impression of a
combined simultaneous image. The pulses used for color flow imaging
are typically three to four times longer than those for the B-mode
image, with a corresponding loss of axial resolution.
Assignment
of color to frequency shifts is usually based on direction (for
example, red for Doppler shifts towards the ultrasound beam and
blue for shifts away from it) and magnitude (different color hues
or lighter saturation for higher frequency shifts). The color Doppler
image is dependent on general Doppler factors, particularly the
need for a good beam/flow angle. Curvilinear and phased array transducers
have a radiating pattern of ultrasound beams that can produce complex
color flow images, depending on the orientation of the arteries
and veins. In practice, the experienced operator alters the scanning
approach to obtain good insonation angles so as to achieve unambiguous
flow images.
|
|
| Table
2 - Factors affecting color flow image |
|
| Main
factors |
Power:
transmitted power into tissue*
Gain:
overall sensitivity to flow signals
Frequency:
trades penetration for sensitivity and resolution*
Pulse
repetition frequency (also called scale): low pulse
repetition frequency to look at low velocities, high pulse
repetition frequency reduces aliasing*
Area
of investigation: larger area reduces frame rate*
Focus:
color flow image optimized at focal zone* |
| Other
factors |
Triplex
color: pulse repetition frequency and frame rate reduced by
need for B-mode/spectral pulses
Persistence:
high persistence produces smoother image but reduces temporal
resolution*
Pre-processing:
trades resolution against frame rate*
Filter:
high filter cuts out more noise but also more of flow signal*
Post-processing
assigns color map/variance*
*Settings
appropriate for specific examinations assigned by set-up/application
keys |
|
| FACTORS
AFFECTING THE COLOR FLOW IMAGE |
The
controls that affect the appearance of the color flow image are
summarized in Table
2. The main factors include:
(1) Power and gain:Color flow uses higher-intensity
power than B-mode. Attention should be paid to safety indices. Power
and gain should be set to obtain good signal for flow and to minimize
the signals from surrounding tissue.
 |
 |
Figure
8 : Setting the color gain to minimize the signals
(artefacts) from surrondng tissue, on left color gain = 71,
then on right decreasing the color gain to 35.
|
(2)
Frequency selection: Many scanner/transducer
combinations permit changes of frequency. High frequencies give
better sensitivity to low flow and have better spatial resolution.
Low frequencies have better penetration (Figure 5) and are less
susceptible to aliasing at high velocities.
(3)
Velocity scale/pulse repetition frequency: Low
pulse repetition frequencies should be used to examine low velocities
but aliasing may occur if high velocities are encountered (Figura
7a,b).
(4)
Region of interest: Because more pulses are needed
to look at flow than for the B-mode image, reducing the width and
maximum depth of the color flow area under investigation will usually
improve frame rate and may allow a higher color scan line density
with improved spatial resolution (Figure
9).
(5) Focus: The focus should be at the level
of the area of interest. This can make a significant difference
to the appearance and accuracy of the image (Figure 7).
 |
 |
| Figure
9 : Set the focus at the region of interest, and also
could use more than one focal zone. |
In
practice, the operator will make many changes to the controls and
will try different probe positions to optimize the image. Practical
guidelines are given in Table
3.
|
|
| Table
3: Color flow imaging:
practical guidelines |
|
|
(1)
Select the appropriate applications/set-up key. This optimizes
parameters for specific
examinations
(2)
Set power to within fetal study limits. Adjust color gain.
Ensure focus is at the region of interest and adjust gain
to optimize color signal
(3)
Use probe positioning/beam steering to obtain satisfactory
beam/vessel angle
(4)
Adjust pulse repetition frequency/scale to suit the flow conditions.
Low pulse repetition frequencies are more sensitive to low
flows/velocities but may produce aliasing. High pulse repetition
frequencies reduce aliasing but are less sensitive to low
velocities
(5)
Set the color flow region to appropriate size. A smaller color
flow ‘box’ may lead to a better frame rate and
better color resolution/sensitivity
|
|
|
| SPECTRAL
OR PULSED WAVE DOPPLER |
Pulsed
wave Doppler ultrasound is used to provide a sonogram of the artery
or vein under investigation (Figure
12). The sonogram provides a measure of the changing
velocity throughout the cardiac cycle and the distribution of velocities
in the sample volume (or gate) (Figure
11). If an accurate angle correction is made, then
absolute velocities can be measured. The best resolution of the
sonogram occurs when the B-mode image and color image are frozen,
allowing all the time to be employed for spectral Doppler. If concurrent
imaging is used (real-time duplex or triplex imaging), the temporal
resolution of the sonogram is compromised.
|
|
|
|
|
Figure
10 (a,b): Doppler spectra of uterine
artery flow. (a) The color flow image allows beam/flow angle
visualization. The sonogram shows high velocities throughout
the cardiac cycle, indicating low distal resistance. (b) The
sonogram shows a pulsatile flow waveform with low diastolic
velocities. This is indicative of high distal resistance
|
 |
(b)
- direction of the Doppler beam
(g) - gate or sample volume
(a) - angle correction
|
Sonogram
of the descending aorta. With the angle correction the peak
velocities could be measured.
|
| Figure
11: Setting up the sample volume |
|
| FACTORS
AFFECTING THE SPECTRAL IMAGE |
The
controls that affect the appearance of the sonogram are summarized
in Table 4.
The main factors include:
(1) Power and gain: Pulsed wave Doppler
uses higher intensity power than B-mode. Attention should be paid
to safety indices. Power and gain should be set so that clear signals
are obtained.
(2) Velocity scale/pulse repetition frequency:
Low pulse repetition frequencies should be used to look at low
velocities but aliasing may occur if high velocities are encountered.
(3) Gate size: If flow measurements are
being attempted, the whole vessel should be insonated. A large gate
may include signals from adjacent vessels (Figure
13).
|
|
| Table
4 - Factors affecting the spectral Doppler image |
|
| Main
factors |
Power:
transmitted power into tissue*
Gain:
overall sensitivity to flow signals
Pulse
repetition frequency (also called scale): low pulse
repetition frequency to look at low velocities,
high pulse repetition frequency reduces aliasing*
Gate
size*
Beam
steering can allow improved beam/flow angle for better
accuracy of velocity
calculation*
Live
duplex/triplex spectral resolution constrained by need
for B-mode/color pulses |
| |
| Other
factors |
Gate:
sharpness of resolution*
Filter:
high filter cuts out more noise but more of flow signal*
Post-processing:
assigns brightness to output*
*Settings
appropriate for specific examinations assigned by set-up/application
keys |
|
|
|
|
 |
| Figure
12: Umbilical cord displaying umbilical artery (red)
and umbilical vein (blue), the gate or sample volume include
both signals (left). Sonogram of the umbilical artery and vein
(right). |
|
|
|
|
Figure
13Influence of gate size. The
spectral Doppler gate insonates an artery and vein and the
sonogram shows flow from both of these vessels. The calculation
of mean velocity (arrow) is meaningless since velocities from
one vessel subtract from those of the other
|
|
| Guidelines
for a practical approach to obtain good-quality spectral images
are given in Table 5
. |
|
| Table
5: Spectral Doppler imaging: practical
guidelines |
|
(1) Set power to within fetal study limits
(2) Position the pulsed wave Doppler cursor on the vessel
to be investigated
(3) Adjust gain so that the sonogram is clearly visible and
free of noise
(4) Use probe positioning/beam steering to obtain a satisfactory
beam/vessel angle. Angles close to 90° will give ambiguous/unclear
values. The beam/vessel angle should be 60° or less if velocity
measurements are to be made
(5) Adjust the pulse repetition frequency/scale and baseline
to suit flow conditions. The sonogram should be clear and
not aliased
(6) Set the sample volume to correct size. Correct the angle
to obtain accurate velocities. Use the B-mode and color flow
image of the vessel to make the angle correction
|
|
|
| BLOOD
FLOW MEASUREMENTS |
| Velocity
measurement |
Theoretically,
once the beam/flow angle is known, velocities can be calculated
from the Doppler spectrum as shown in the Doppler equation. However,
errors in the measured velocity may still occur 1,4.
Sources of error can be broadly divided into three categories.
(1) Errors can arise in the formation of the Doppler
spectrum due to:
(a) Use of multiple elements in array transducers;
(b) Non-uniform insonation of the vessel lumen;
(c) Insonation of more than one vessel;
(d) Use of filters removing low-velocity components.
(2) Errors can arise in the measurement of the
ultrasound beam/flow velocity angle.
(a)
Use of high angles (q > 60o) may give rise to error
because of the comparatively large changes in the cosine of the
angle which occur with small changes of angle (Figure
14).
(b)
The velocity vector may not be in the direction of the vessel axis.
(3)
Errors can arise in the calculation packages provided by the manufacturers
for analysis of the Doppler spectrum (for instance, of intensity
weighted mean velocity).
(a)
While efforts can be made to minimize errors, the operator should
be aware of their likely range. It is good practice to try to repeat
velocity measurements, if possible using a different beam approach,
to gain a feel for the variability of measurements in a particular
application. However, even repeated measurements may not reveal
systematic errors occurring in a particular machine.
(b)
The effort applied to produce accurate velocity measurements should
be balanced against the importance of absolute velocity measurements
for an investigation.
(c)
Changes in velocity and velocity waveform shape are often of more
clinical relevance when making a diagnosis. In this and other cases,
absolute values of velocity measurement may not be required.
|
| |
 |
 |
|
Figure
14: Effect of high vessel/beam
angles. (a) and (b) A scan of fetal aortic flow is undertaken
at a high beam/vessel angle. Beam/flow angles should be kept
to to 60° or less. A hudge discrepancy is observed when use
unapropiate angles > 60°. If absolute velocities are to
be measured, beam/flow angles should be kept to 60° or less.
|
|
| Calculation
of absolute flow |
Total
flow measurement using color or duplex Doppler ultrasound is fraught
with difficulties, even under ideal conditions 5. Errors
that may arise include:
(1) Those due to inaccurate measurement of vessel cross-sectional
area, for example the cross-sectional area of arteries which pulsate
during the cardiac cycle;
(2) Those originating in the derivation of velocity (see above).
These errors become particularly large when flow calculations are
made in small vessels; errors in measurement of diameter are magnified
when the diameter is used to derive cross-sectional area. As with
velocity measurements, it is prudent to be aware of possible errors
and to conduct repeatability tests.
|
| Flow
waveform analysis |
Non-dimensional
analysis of the flow waveform shape and spectrum has proved to be
a useful technique in the investigation of many vascular beds. It
has the advantage that derived indices are independent of the beam/flow
angle.
Changes in flow waveform shape have been used to investigate both
proximal disease (e.g. in the adult peripheral arterial circulation)
and distal changes (in the fetal circulation and uterine arteries).
While the breadth of possible uses shows the technique to be versatile,
it also serves as a reminder of the range of factors which cause
changes to the local Doppler spectrum. If waveform analysis is to
be used to observe changes in one component of the proximal or distal
vasculature, consideration must be given to what effects other components
may have on the waveform.
|
| Flow
waveform shape: indices of measurement |
Many
different indices have been used to describe the shape of flow waveforms
1 . Techniques range from simple indices of systolic
to diastolic flow to feature extraction methods such as principal
component analysis. All are designed to describe the waveform in
a quantitative way, usually as a guide to some kind of classification.
In general, they are a compromise between simplicity and the amount
of information obtained.
|
|
|
| Figure
15: Arterial velocity sonogram (waveform). |
|
The
relative merits of indices used in uterine arteries have been discussed
elsewhere. 6,7 .Commonly used indices available on most
commercial scanners are:
(1) Resistance index (RI) (also called resistive index or Pourcelot’s
index);
(2) Systolic/diastolic (S/D) ratio, sometimes called the A/B ratio;
(3) Pulsatility index (PI) 8.
These indices are all based on the maximum Doppler shift waveform
and their calculation is described in Figure 12. The PI takes slightly
longer to calculate than the RI or S/D ratio because of the need
to measure the mean height of the waveform. It does, however, give
a broader range of values, for instance in describing a range of
waveform shapes when there is no end-diastolic flow.
|
 |
| Figure
16 - Flow velocity indices |
|
In
addition to these indices, the flow waveform may be described or
categorized by the presence or absence of a particular feature,
for example the absence of end-diastolic flow and the presence of
a post-systolic notch.
Generally, a low pulsatility waveform is indicative of low distal
resistance and high pulsatility waveforms occur in high-resistance
vascular beds (Figure 8), although the presence of proximal stenosis,
vascular steal or arteriovenous fistulas can modify waveform shape.
Care should be taken when trying to interpret indices as absolute
measurements of either upstream or downstream factors. For example,
alterations in heart rate can alter the flow waveform shape and
cause significant changes in the value of indices.
|